
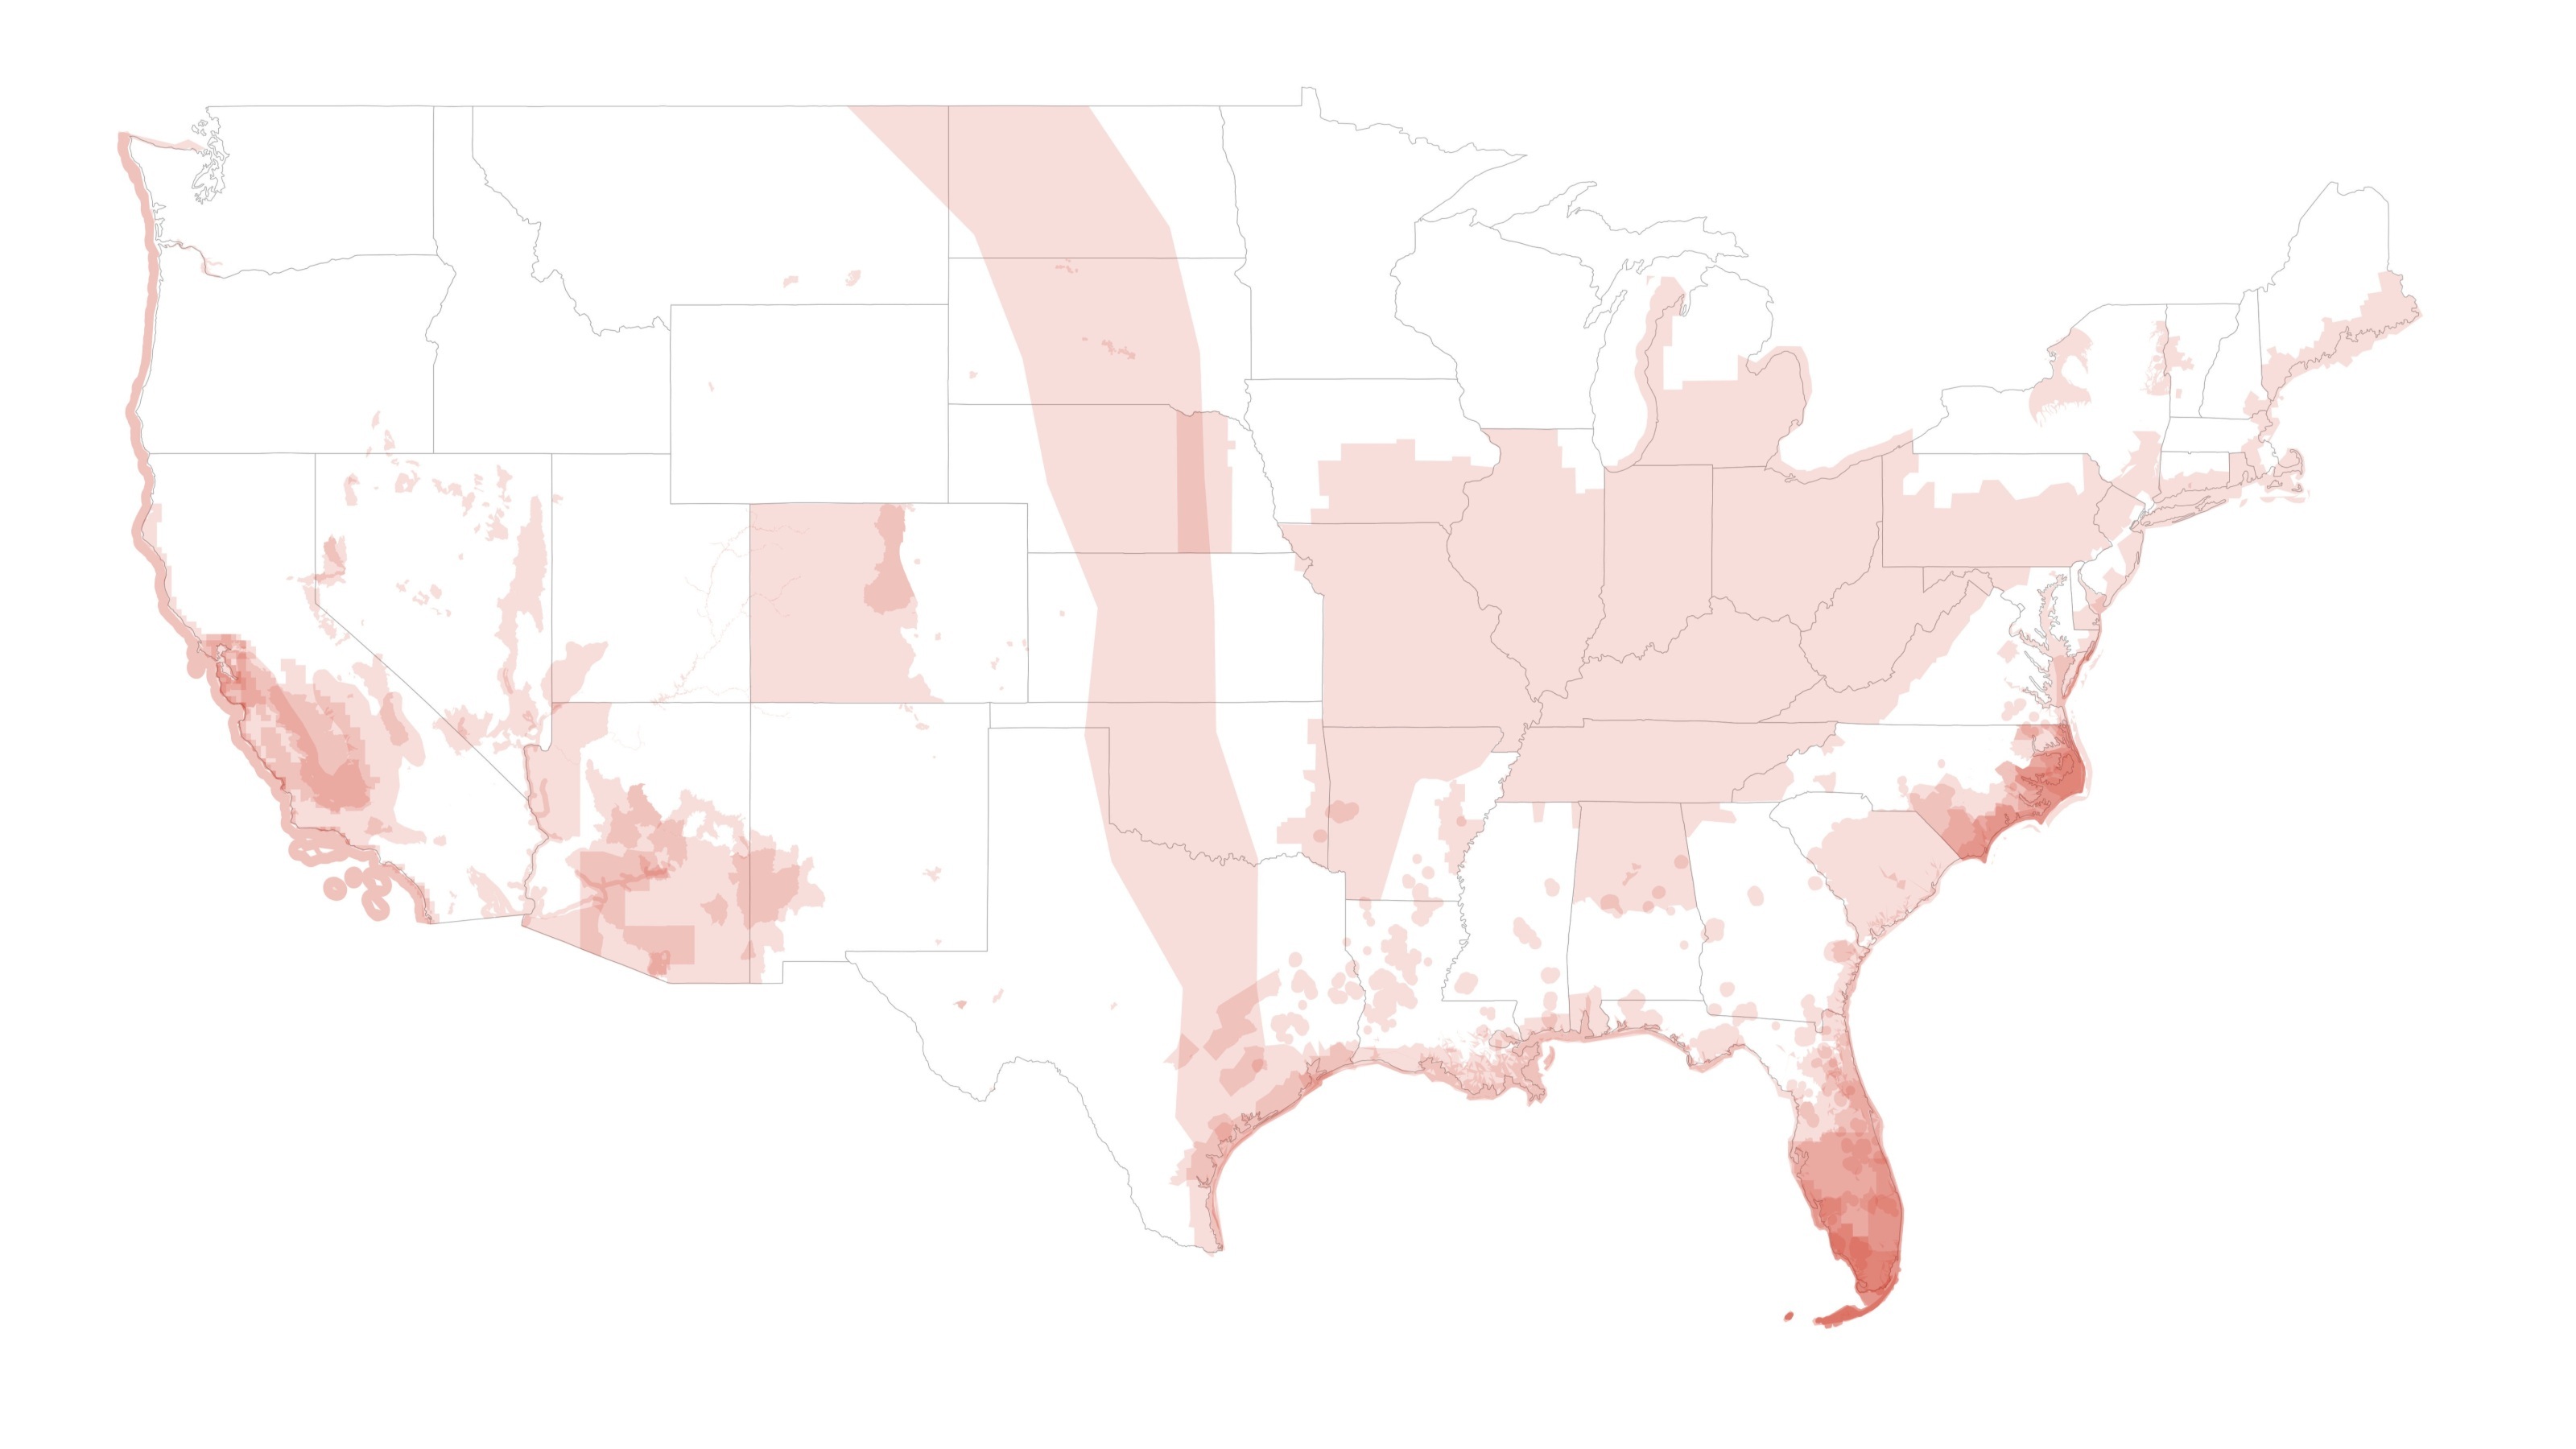
(a) 1970 (82 species)
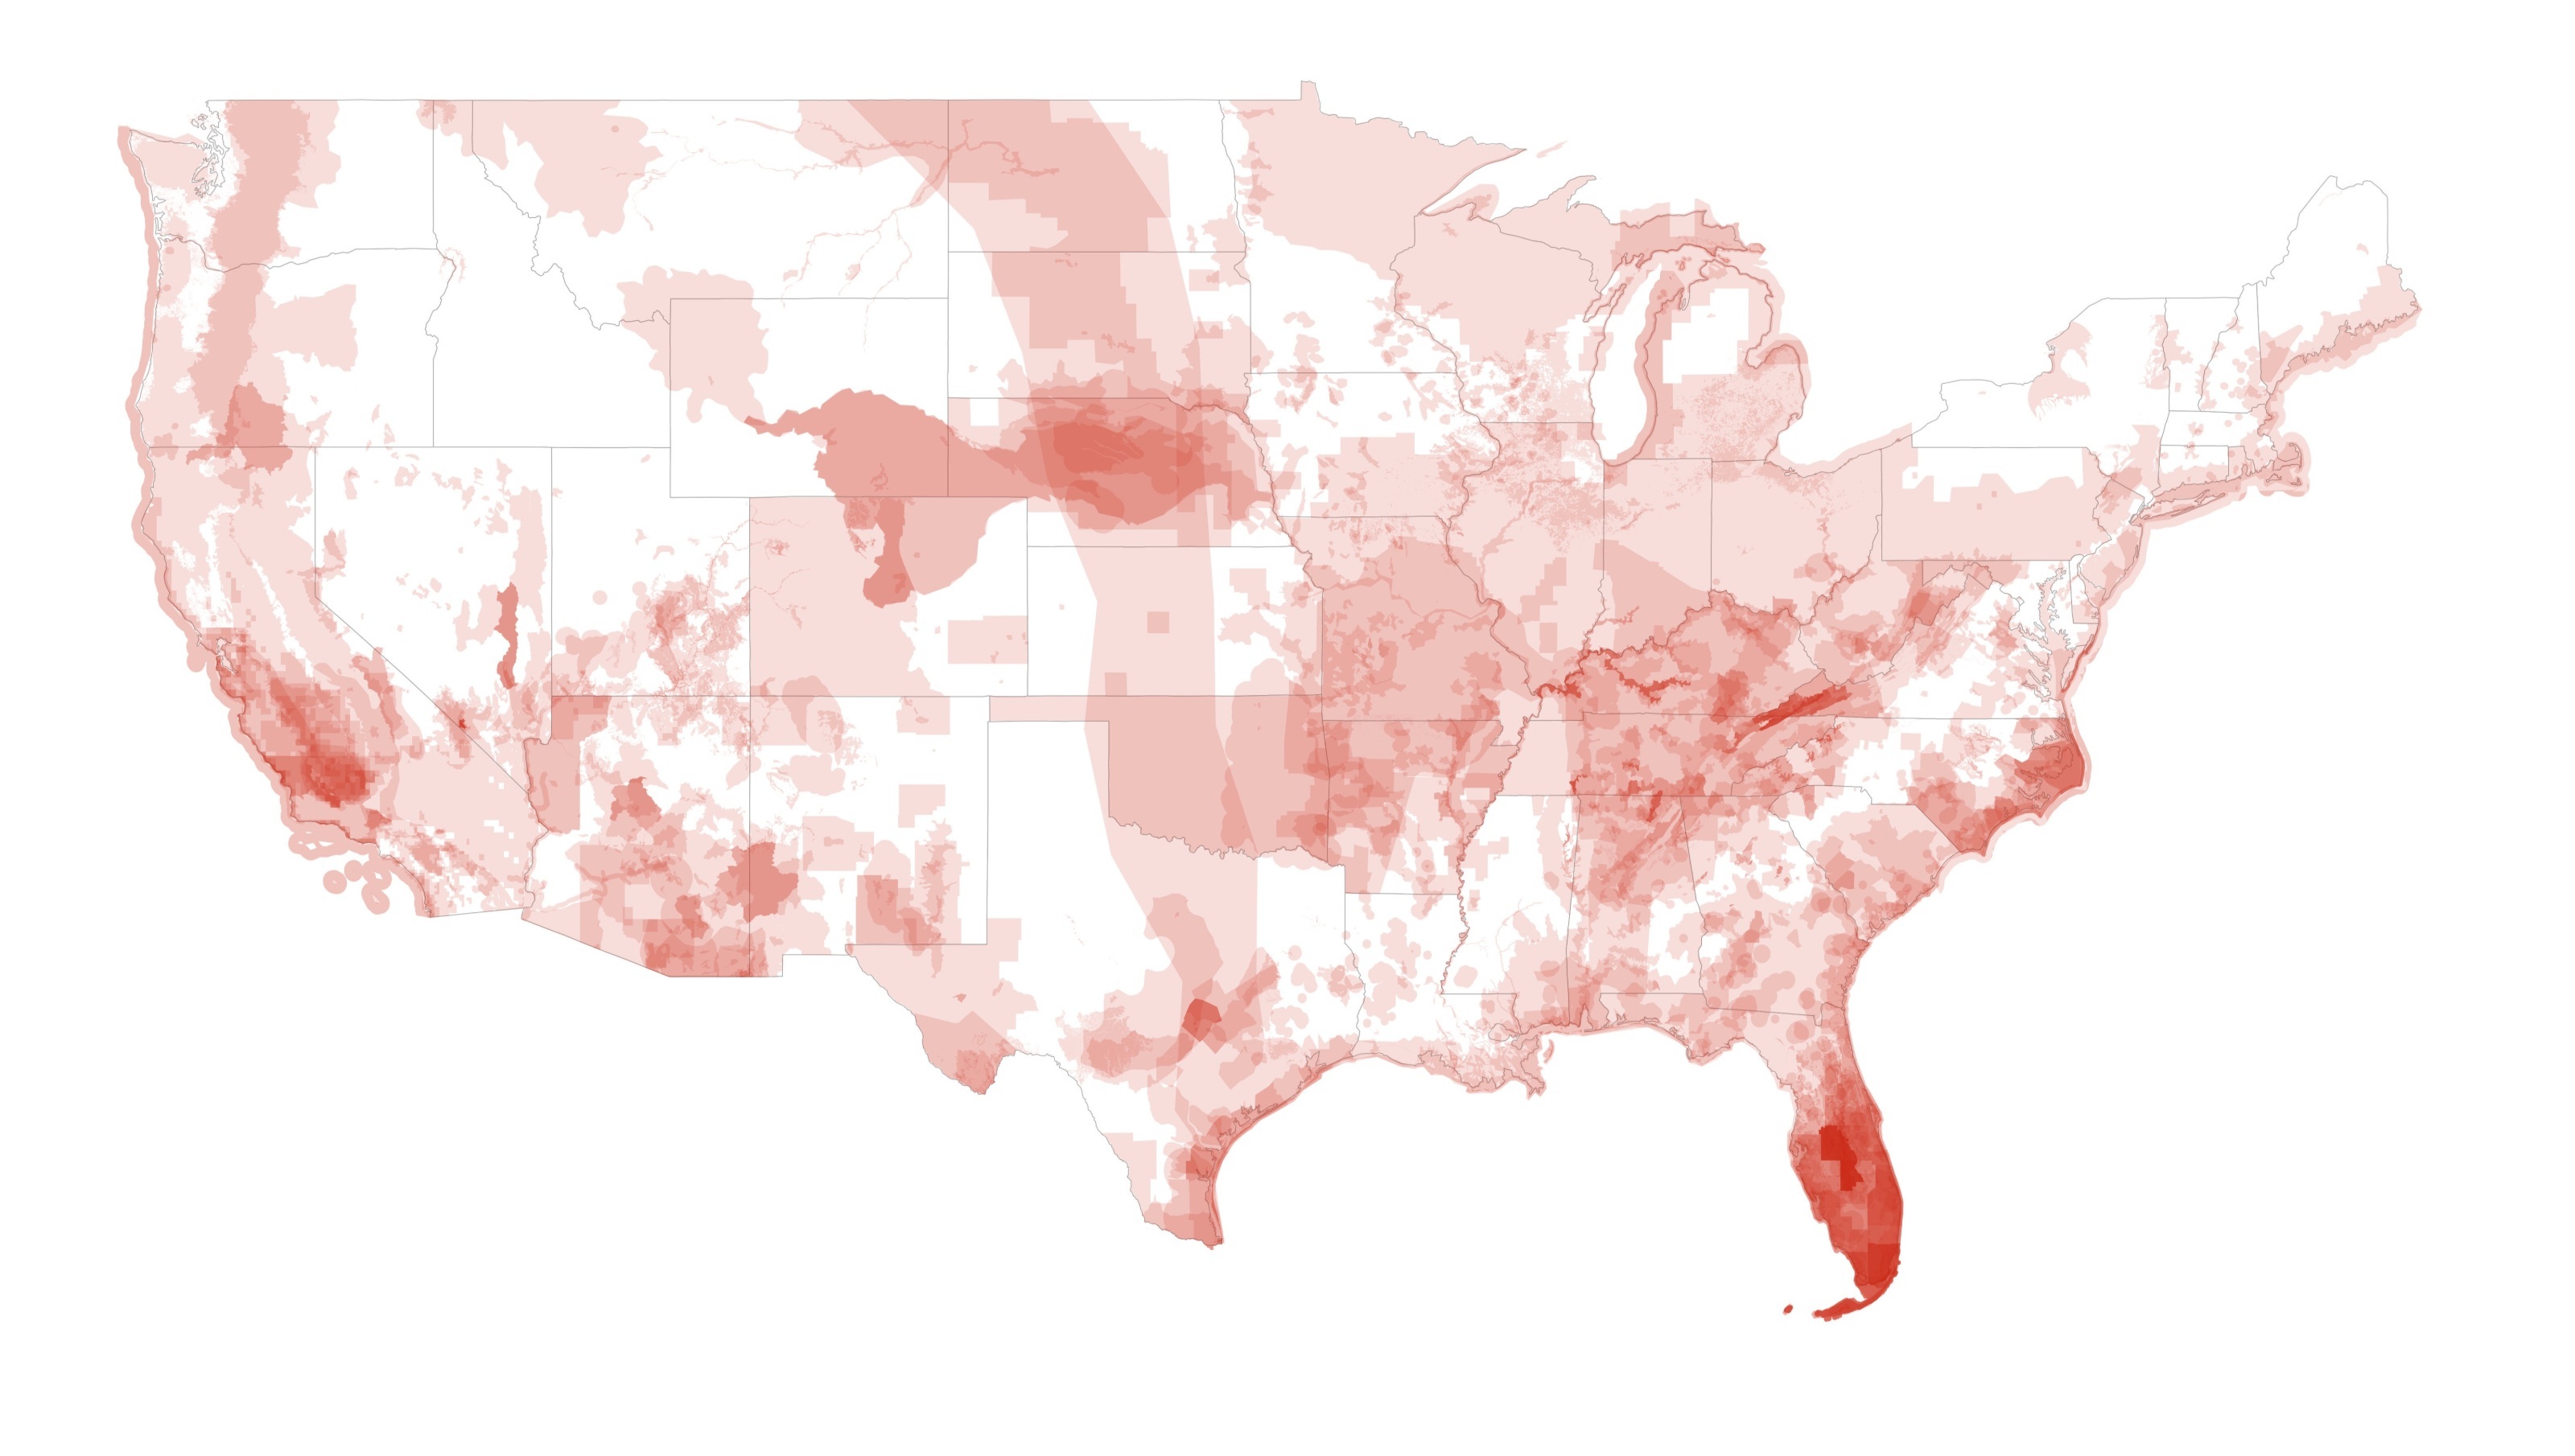
(b) 1990 (465 species)
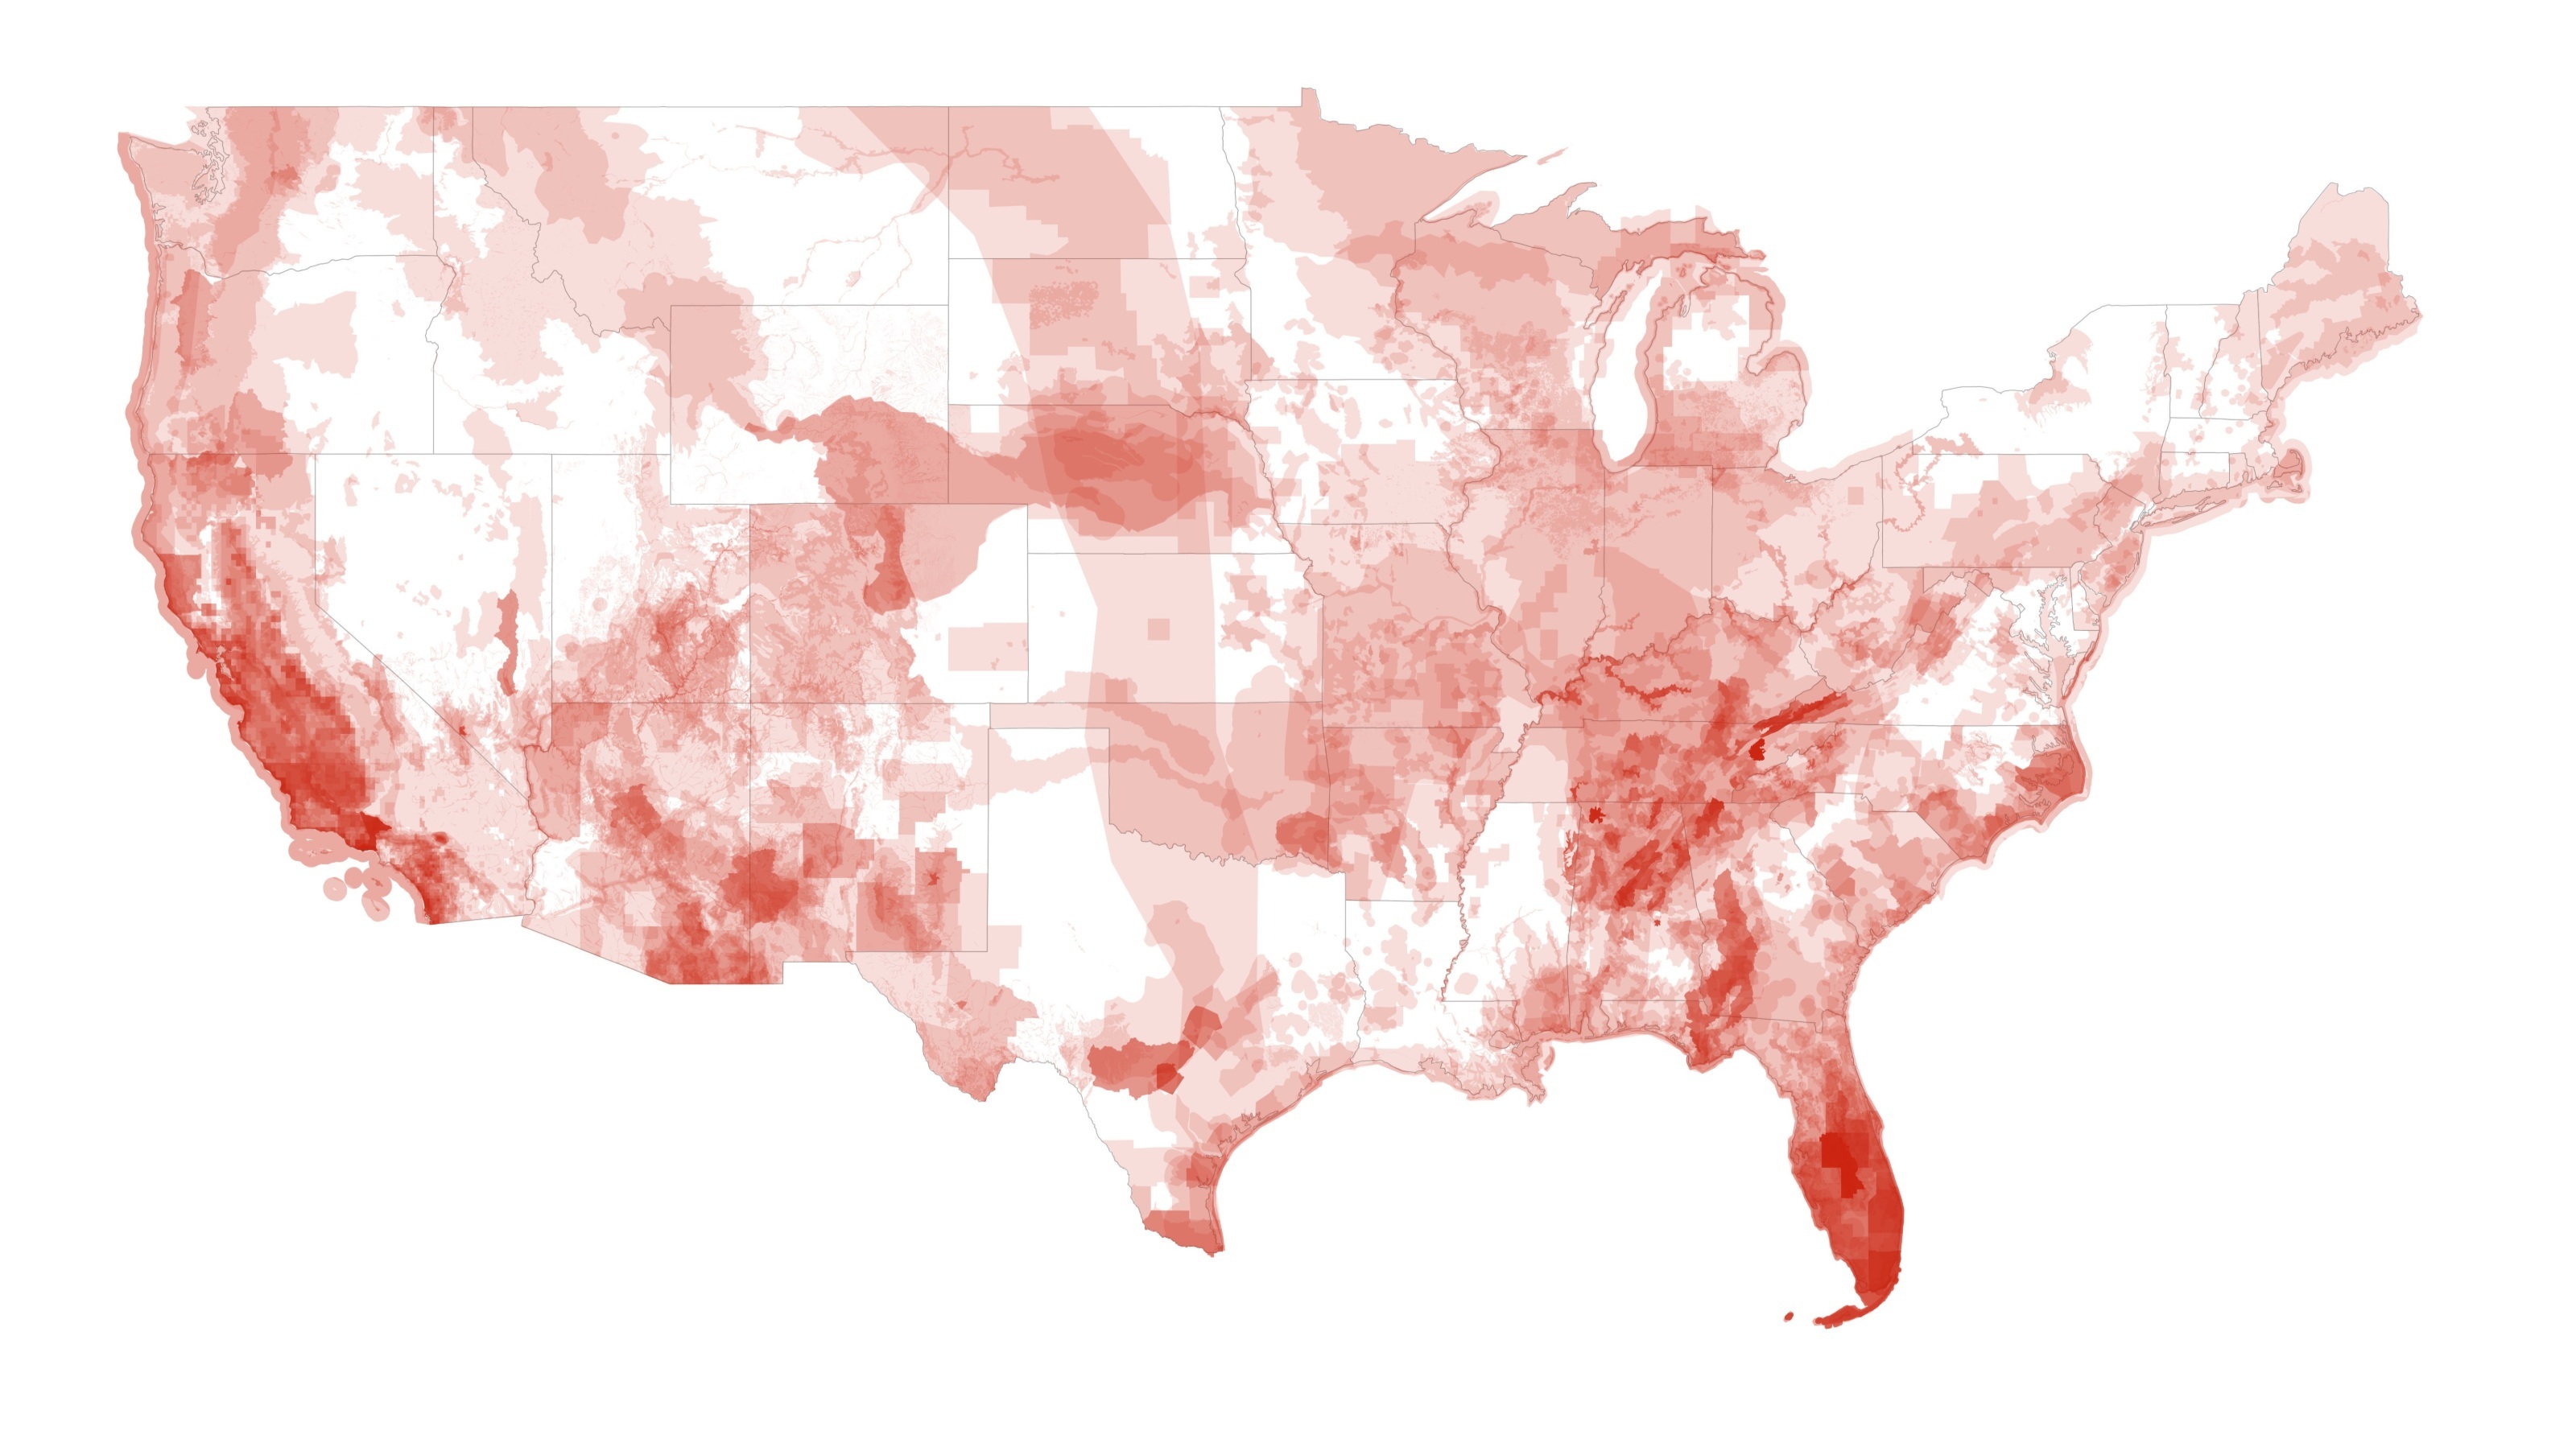
(c) 2010 (1,164 species)
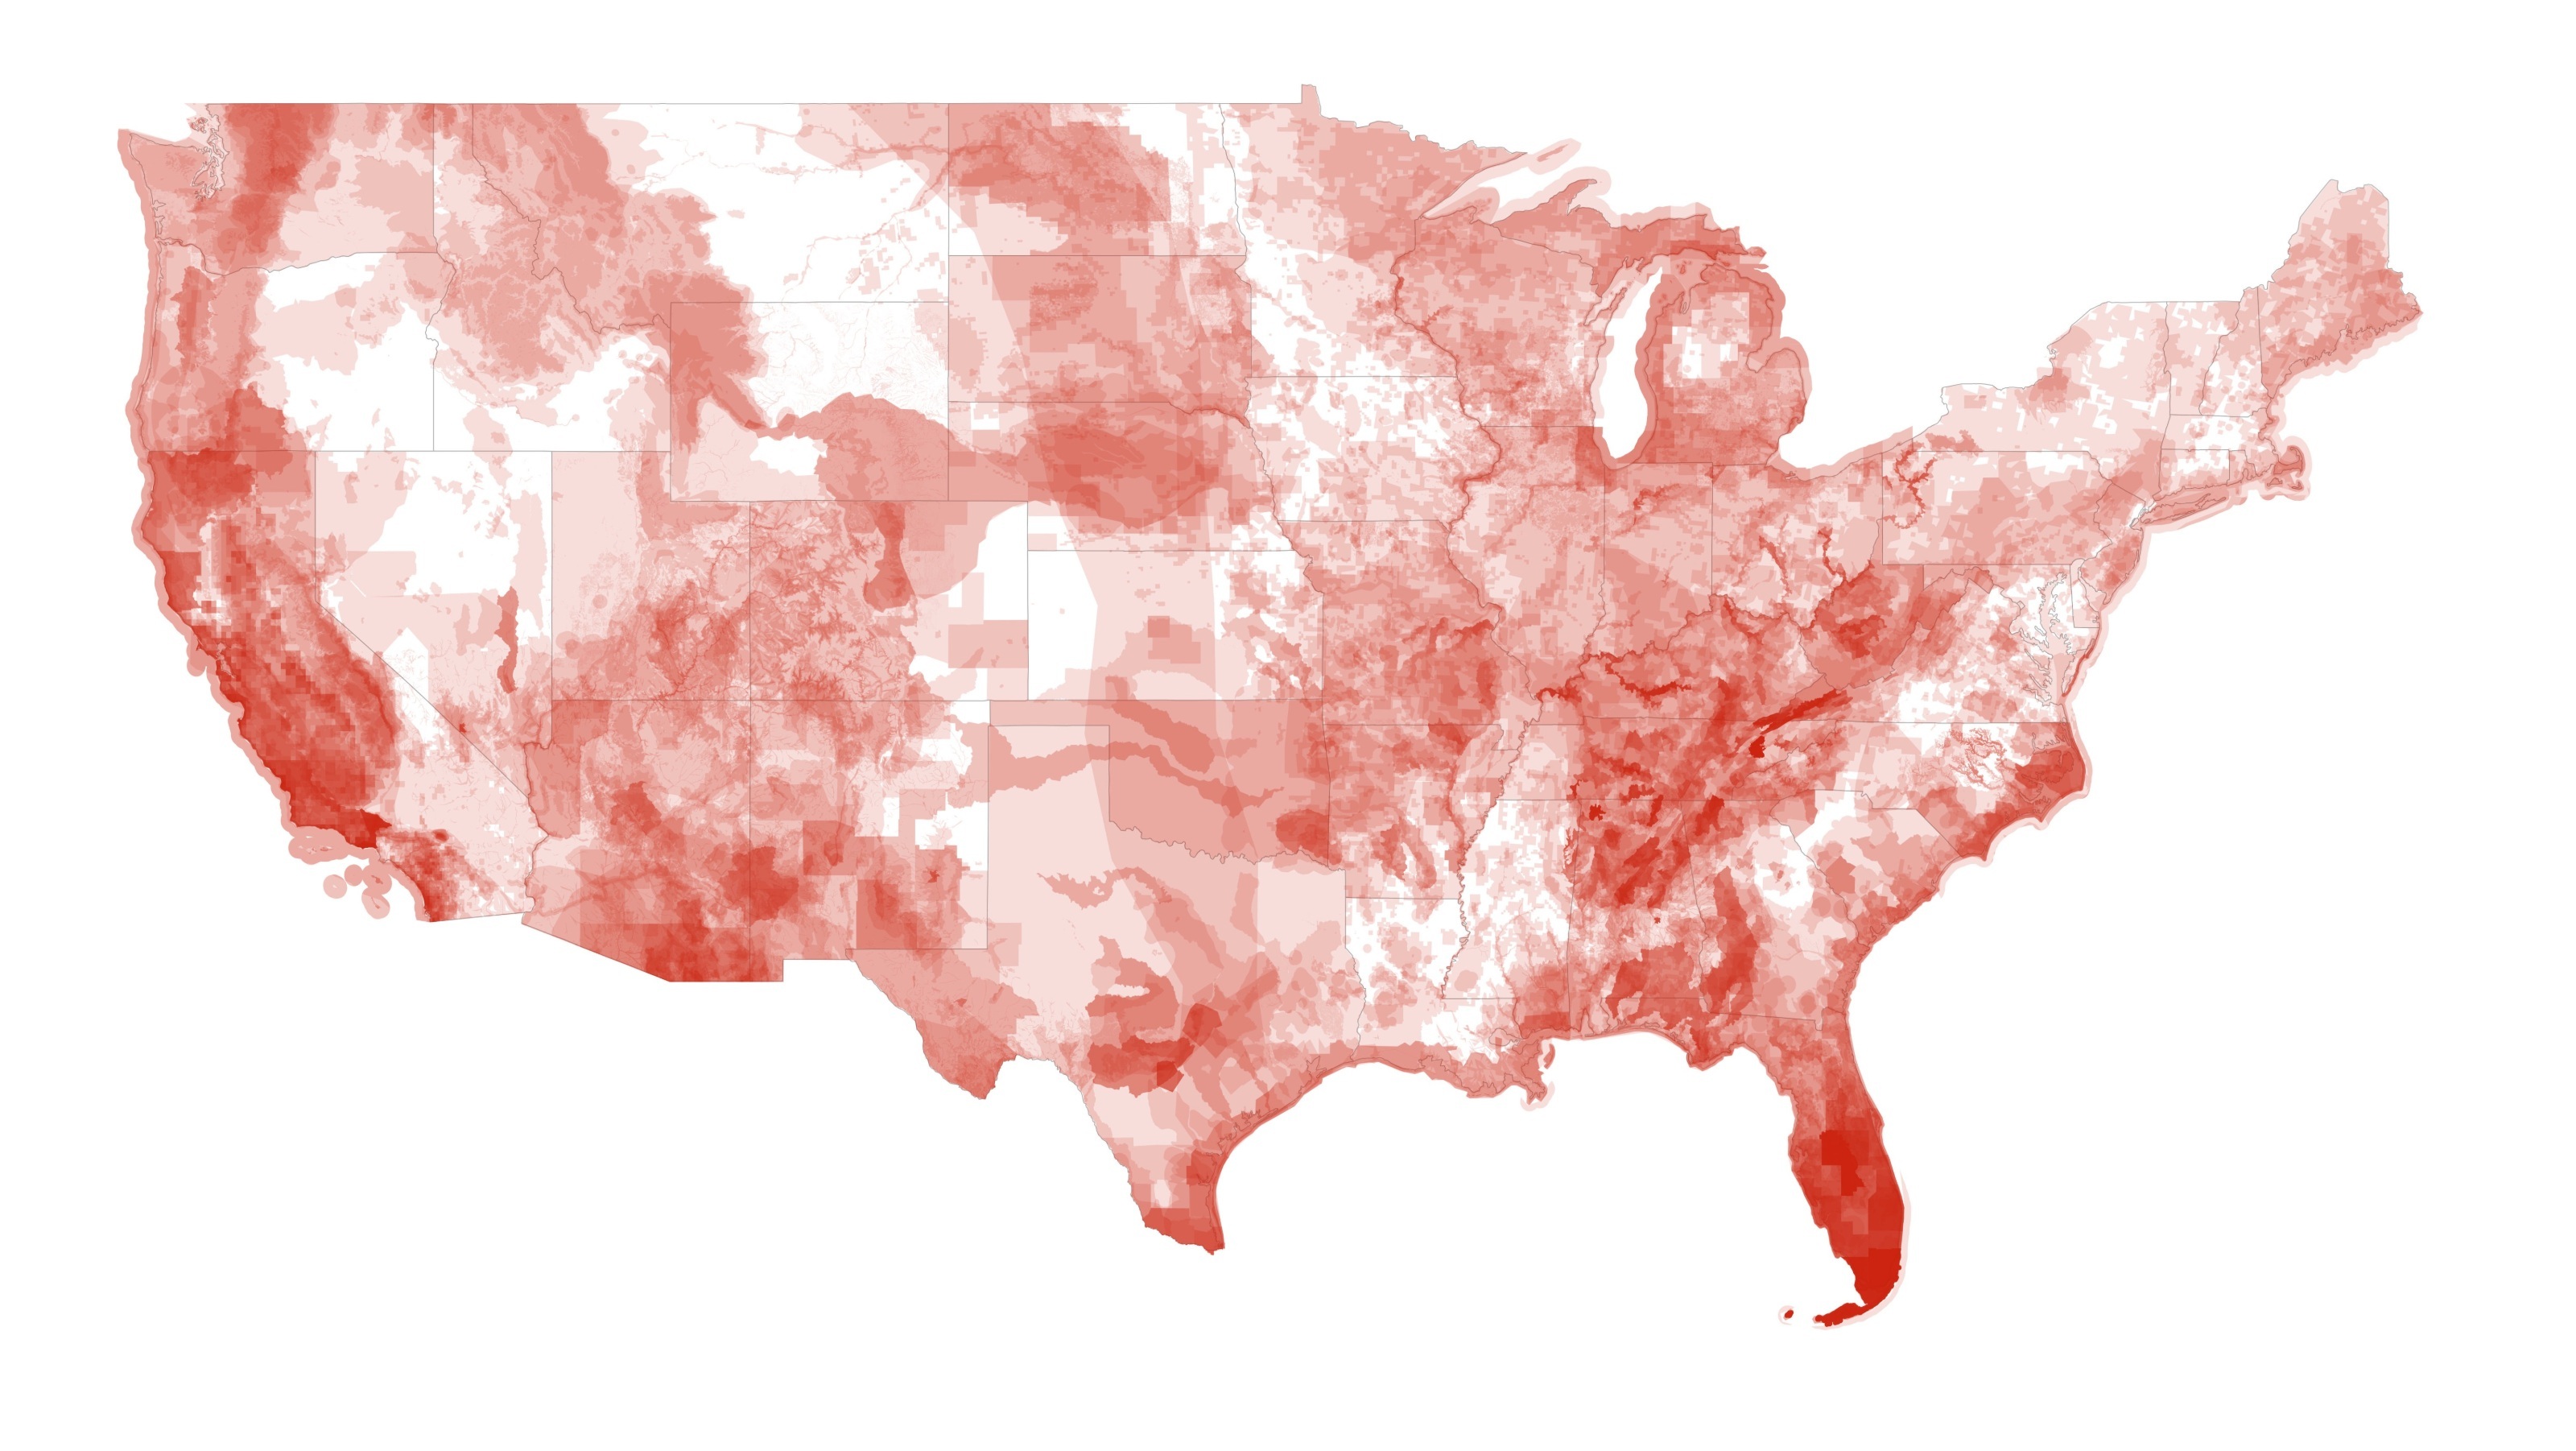
(d) 2025 (1,465 species)
1. Introduction
Housing has become expensive because supply is constrained in cities where demand is high and growing. An important driver of these supply constraints is environmental land use regulation. This paper studies “the strongest environmental law in the world,” the Endangered Species Act (ESA), and finds large negative effects on housing permit flows, including mistargeted effects on construction in already-developed areas where endangered habitat may not be at stake.
Section 9 of the Endangered Species Act prohibits “harming or harassing” any endangered animal species. Clearing land and building houses are obvious forms of “harming or harassing,” but milder habitat disturbances such as noise, light pollution, and stormwater runoff can also constitute a violation of the ESA. Stronger regulations on federal actions in Section 7 of the ESA spread to private housing construction via federal permitting, land, and funding.
Crucially, these regulations only apply near the habitats of endangered animals. The list of endangered animals varies over time and their habitats vary across space, so the land use regulation attached to these species also varies. Each addition to the endangered species list adds a layer of regulation to areas which happen to host that species but not to others. In 1980, for example, 200 plant and animal species were listed as endangered or threatened and in 2025 there were 1,465 such listings. Each listed species has a distinct habitat. Thus, the growing list of protected habitats is a source of detailed variation in the intensity of land use regulation.
This paper studies the effect of these regulations on housing construction. In a staggered difference-in-difference framework, exploiting 1,200+ species listings across the U.S. from 1980–2024, I find that the average treated place reduces its annual permit flows by 0.52 permits per thousand 1980 residents after a species listing, about 10% of the average annual flow.
Aggregating this effect over all listings since 1980 implies that land use regulations under the ESA have displaced or deterred 9.1 million housing permits. The 95% confidence interval around the central treatment effect implies a range of 2–16 million displaced or deterred permits. I estimate that 70% of the treatment effect comes from deterred permits that do not show up elsewhere. Thus, ESA listings have reduced U.S. housing stock by between 1.6 and 11.1 million units, with a central estimate of 6.3 million units, about 4% of 2025 housing stock.